
Recognizing Matplotlib: An Open Source Visualization Framework
Recognizing Matplotlib: An Open Source Visualization Framework
Introduction:
The utilization of efficient data visualization is of utmost importance within the domains of scientific computing and data analysis, as it facilitates the comprehension of vast and intricate information, as well as the dissemination of valuable discoveries. Matplotlib, a comprehensive Python 2D charting library, serves as the fundamental framework for generating exceptional visual representations. This essay aims to examine the primary attributes of Matplotlib, along with its applications in data visualization, advanced techniques, practical implementations, and its position within the broader Python community.
What is Matplotlib?

Matplotlib, initially conceived by John D. Hunter, has evolved into a versatile software library capable of accommodating a diverse array of plot types, encompassing bar charts, histograms, scatter plots, line plots, and various more. Due to its inherent flexibility, individuals have the potential to create visual representations that are suitable for a diverse array of data analysis tasks, including statistical analysis, exploratory data analysis, and the concise and comprehensible portrayal of intricate information.
Utilizing Matplotlib for Data Visualization Applications
Exploratory Data Analysis (EDA) involves the utilization ofMatplotlib to visually analyze datasets in order to identify trends, patterns, and outliers. This approach enables analysts to enhance their comprehension of the fundamental data distribution.
Scientific visualization is a widely employed methodology for effectively representing empirical data, simulation results, and scientific principles within many fields such as physics, engineering, and biology.
Matplotlib is a highly valuable tool for the purpose of presenting research findings and publishing scientific papers due to its ability to generate high-quality graphics that are suitable for publication.
Advanced Methods and Personalized Settings in Matplotlib
Matplotlib offers a range of customization options for the various parts of a plot, including line styles, markers, colors, labels, and annotations. These elements can be readily tailored to meet specific requirements. Moreover, the software encompasses advanced functionalities that cater to the diverse requirements of scholars and data analysts, encompassing a multitude of axes, subplots, and three-dimensional plots. Cutting-edge approaches enable users to effectively convey intricate data relationships and insights through the creation of elaborate and visually captivating visualizations.
Matplotlib Integration with Additional Python Libraries
Matplotlib exhibits seamless integration with a diverse array of Python libraries, hence broadening its scope of application and augmenting its capabilities. Several noteworthy integrations include Seaborn, which enhances the visual appeal of statistical graphics, Pandas, which facilitates data analysis, and NumPy, which enables efficient data manipulation. Through the integration of many libraries, users have the ability to construct extensive data analysis pipelines, thereby enhancing their analytical capabilities and optimizing their workflows for data visualization. This collaborative ecosystem facilitates the seamless collaboration and utilization of various tools and resources.
Top Tips for Using Matplotlib to Visualize Data Effectively
● Choosing the Proper Plot Type: In order to effectively convey the intended message, it is imperative to possess a comprehensive comprehension of the inherent characteristics of the data at hand, as well as to carefully deliberate and choose an appropriate plot style that aligns with the desired objectives.
● Customizing Visual Elements: The utilization of customization options enhances the overall effectiveness of the visualization by enhancing its aesthetic appeal and its capacity to convey more information through the manipulation of colors, labels, and annotations.
● Keeping It Simple: Simplifying the visualization by eliminating unnecessary information and reducing complexity enhances its comprehensibility and facilitates the dissemination of insights to a broader audience.
Obstacles and Upcoming Improvements for Matplotlib
In contrast to recent visualization libraries, Matplotlib exhibits limits in terms of interactive capabilities and aesthetic appeal, despite its widespread usage. In order to maintain competitiveness and relevance within the dynamic landscape of data visualization tools, recent advances in Matplotlib have focused on enhancing interactivity and refining default aesthetics.
Realistic Coding Samples
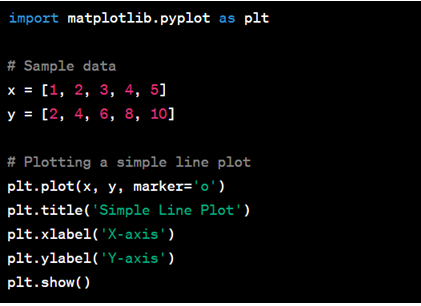
Example of a Line Plot
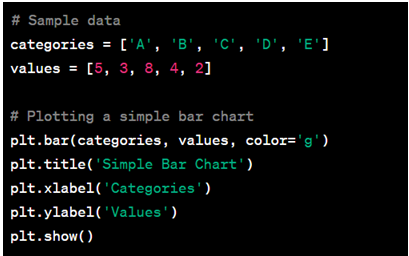
Example of a Bar chart
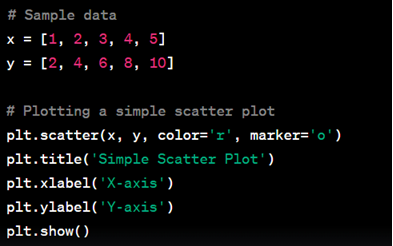
Example of a Scatter plot
Wrapping Up
In summary, it can be concluded that visualizations play a significant role in enhancing the process of data processing. All in all, Matplotlib has established itself as a prominent element in Python’s data visualization domain, facilitating the identification of significant patterns and effective communication of complex information for scientists, researchers, and data analysts. Matplotlib remains a crucial component in the data visualization procedure due to its extensive range of functionalities, flexibility, and seamless integration with other Python libraries. These tools enable users to fully leverage the possibilities of their data.
In addition to this, if you have a keen intention to learn more about the other versatile Python Libraries and tools, you can learn it from the Best Python Training Institute in India and that is Craw Security, a sister vertical of News4Hackers, the Best Cybersecurity Info, and News Portal. Here at Craw Security, you will be able to learn the best fundamentals of Python from highly qualified and well-trained Python instructors cum developers in a detailed and user-friendly manner. To get more info on upcoming batches and other crucial details, give them a call at +91-9513805401 and have a word with their greatly experienced educational consultants.

Read More Article Here
Features of Linux
The Impact of AI on Cybersecurity: Pros & Cons
Analysis Started Coming From Security Analysts After Massive Data Breach of Adhaar Card